Create multiple dashboards
Organise recurring views around the markets, categories or questions you follow.
Your markets. Your dashboard.
Create multiple dashboards, bring relevant price and market information into one recurring view and share that view with colleagues.
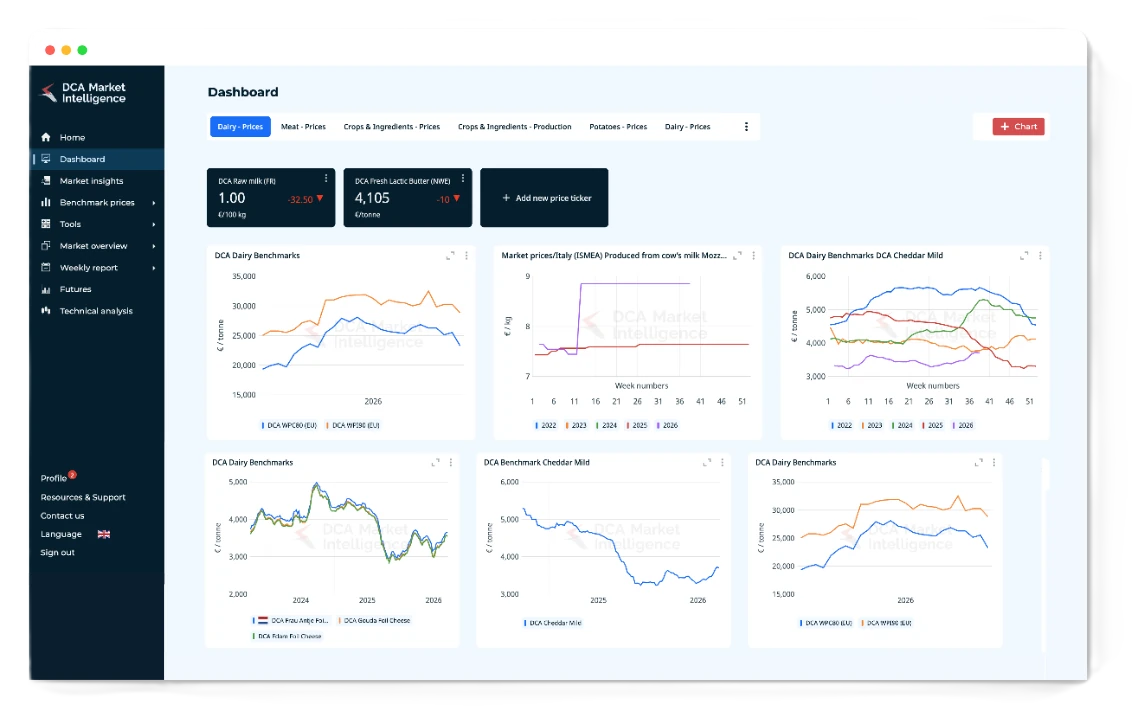
One view for your market
Start with the dashboards and charts already relevant to your role. Add price series, production or market indicators as your information needs change, and share those views across your team.
Organise recurring views around the markets, categories or questions you follow.
Add and compare the available price series and market data in the periods you need.
Give colleagues access to a dashboard so everyone works from the same market view.
Create the view you need
Choose price series from DCA Market Intelligence and add them to your dashboard. Combine related series in a chart, change the time period and create separate views for different markets or products.

Share the same market view
Give colleagues access to dashboards you have created so teams can follow the same charts and price series without maintaining separate versions.
Shared dashboards make it easier to use a consistent market view across procurement, trading, planning and management.
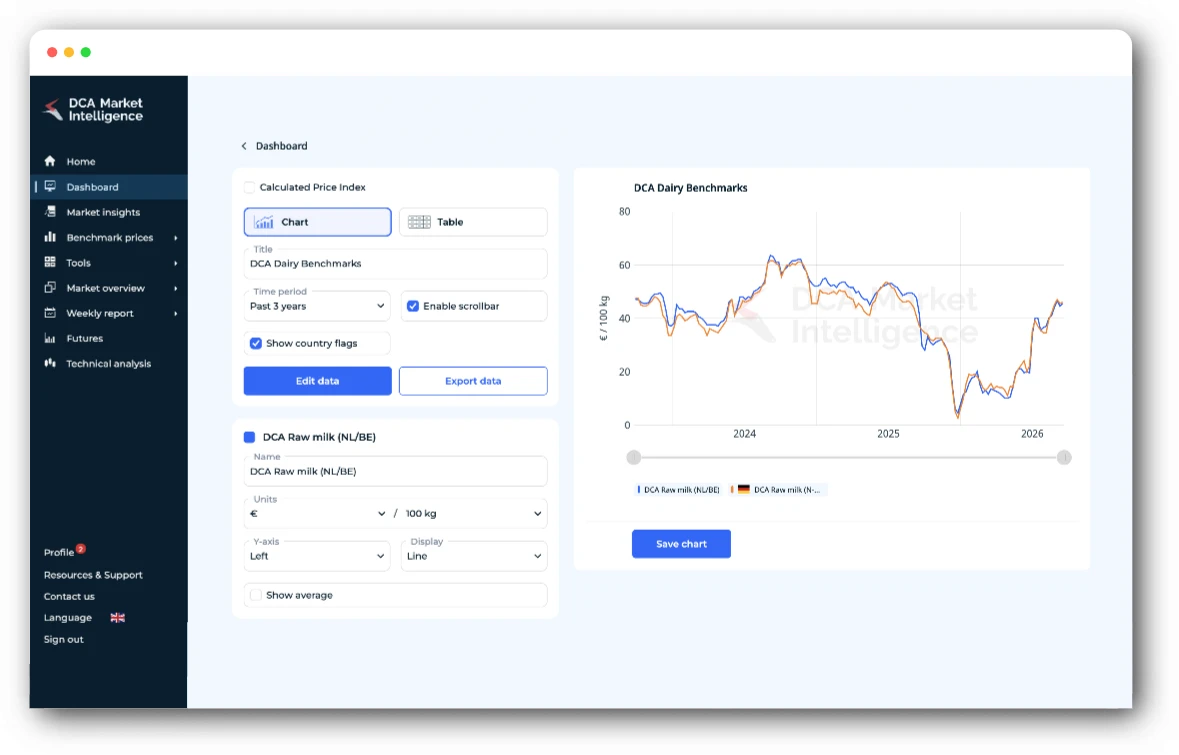
Different teams, different dashboards
Use separate dashboards while keeping the underlying market information consistent across the organisation.
Follow relevant benchmarks, products and connected markets in one recurring view.
Bring current prices and related market series together to monitor market developments.
Follow prices and market indicators relevant to supply, availability and planning.
Connected platform workflow
Use dashboards as your recurring market overview, then open an individual series to inspect its history, specification and connected market information.
Need help setting up the right views? Our team can help you translate your markets and workflow into focused dashboards.
Meet our team
Personal platform walkthrough
Choose a time with Vincent and see the DCA platform around the markets and workflows relevant to you.